Home / Work / Jira performance
Jira performance · Atlassian
Made Jira up to twice as fast for its largest boards, and lifted retention 14%
Customers said Jira was slow. The average load time said it was fine. The average was hiding the customers who were suffering.
- Role Product Manager, Jira Software Technical Performance
- When July 2020 to September 2021
Overview
"Jira is slow" was one of the most common things customers told us
Some enterprise customers with large boards were leaving, and many didn't even call it slowness: they reported bugs. The dashboards disagreed with them. Average load time looked acceptable and wasn't getting worse.
I was the product manager for Jira Software's technical performance, and none of us on the team, me included, had done performance work before. "Make Jira faster" is about as ambiguous a brief as you can get.
Insight
The average was hiding the customers we were about to lose
I changed the measure from the average to the 90th percentile: how slow Jira was for the slowest tenth of loads. Then I built a cohort in SQL of boards with 1,000 to 1,500 tasks. Those boards were the slow ones. They belonged to larger customers, and the people using them were quietly leaving.
Shipped
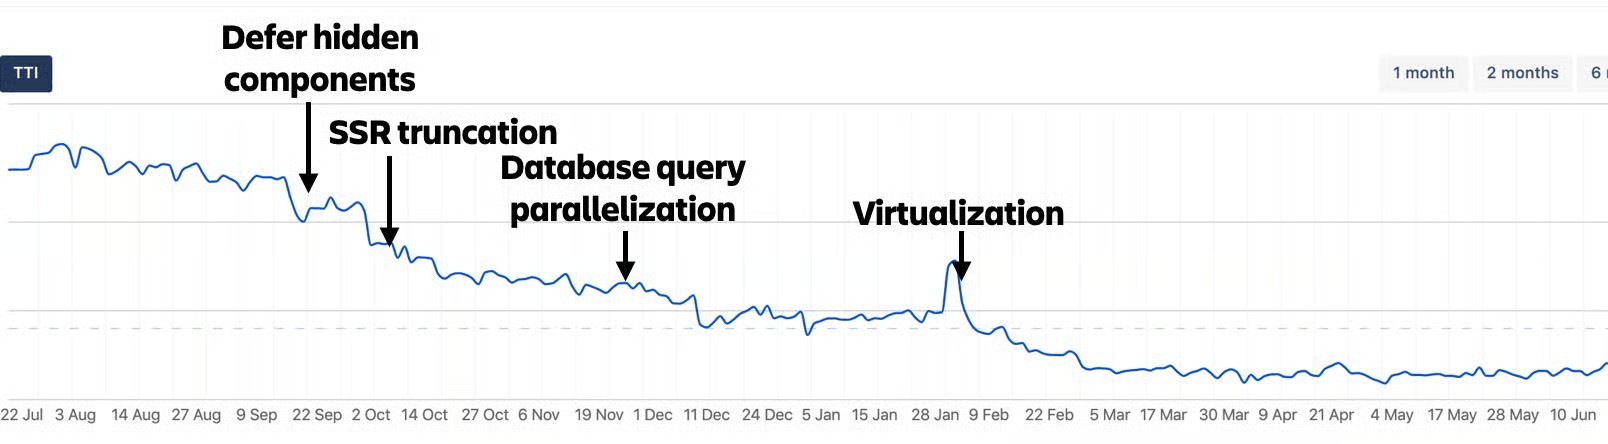
A year of fast experiments, four of which moved the line most
Trade-off
The fastest fix broke a habit, so we asked what the habit was for
Drawing only the rows on screen was one of our most effective techniques. It also broke the browser's own find, Cmd-F, because the browser can only search what has been drawn. People noticed.
Rather than treat it as a performance problem, I worked with engineering and design on what people were actually trying to do. In a large backlog, they weren't searching the page. They were trying to find an issue among thousands. So instead of protecting the browser's find at any cost, we invested in a search that worked across everything, drawn or not, and pointed Cmd-F straight at it. It fit a core, high-traffic job and took a few sprints, against alternatives with lower impact or longer lead times.
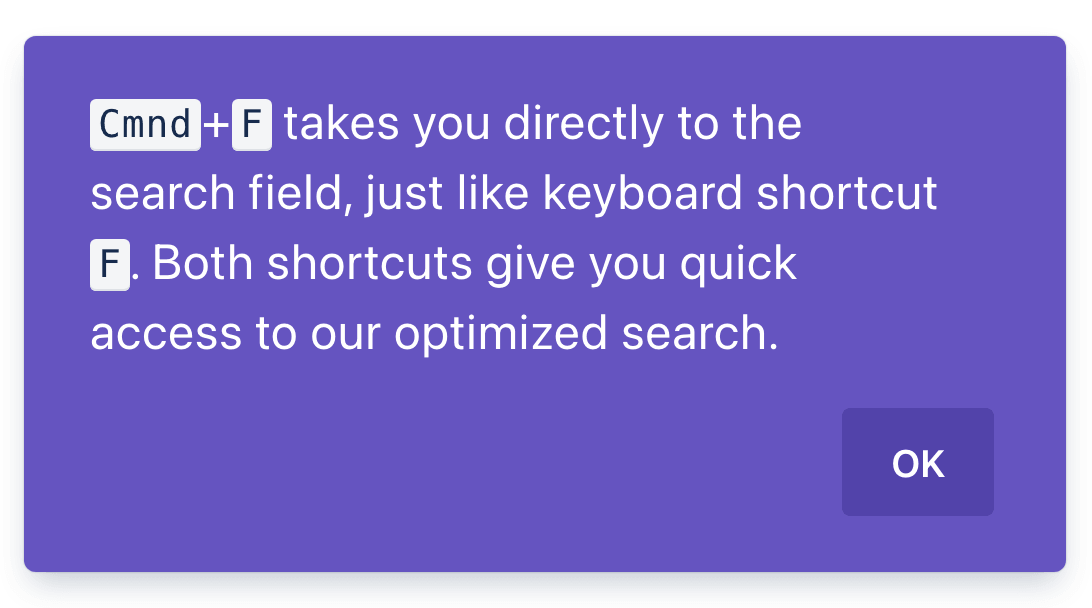
Changing a shortcut people use without thinking needs explaining, so a small prompt told them what Cmd-F did now, and why it was better.
Performance work almost always forces trade-offs in the experience. The job is deciding which behaviours are core to what people are trying to do, and which can change.What I took from it
Team
A team new to performance work, and how it ran
Before we touched the backlog, I ran an induction on the problem with performance experts from across Atlassian: what we were solving, why it mattered to customers, and what good looked like. You can't motivate people towards something ambiguous, so the first job was making it concrete.
By the end, one of the two leads had been promoted to Principal Engineer and the other became an Engineering Manager. I can't claim I caused that. I did make sure their work was visible and linked to them.
Customers
Customers noticed before we told them
About four weeks after the first changes shipped, a customer replied to one of my posts on the Atlassian Community. They had been close to giving up on Jira for planning altogether.
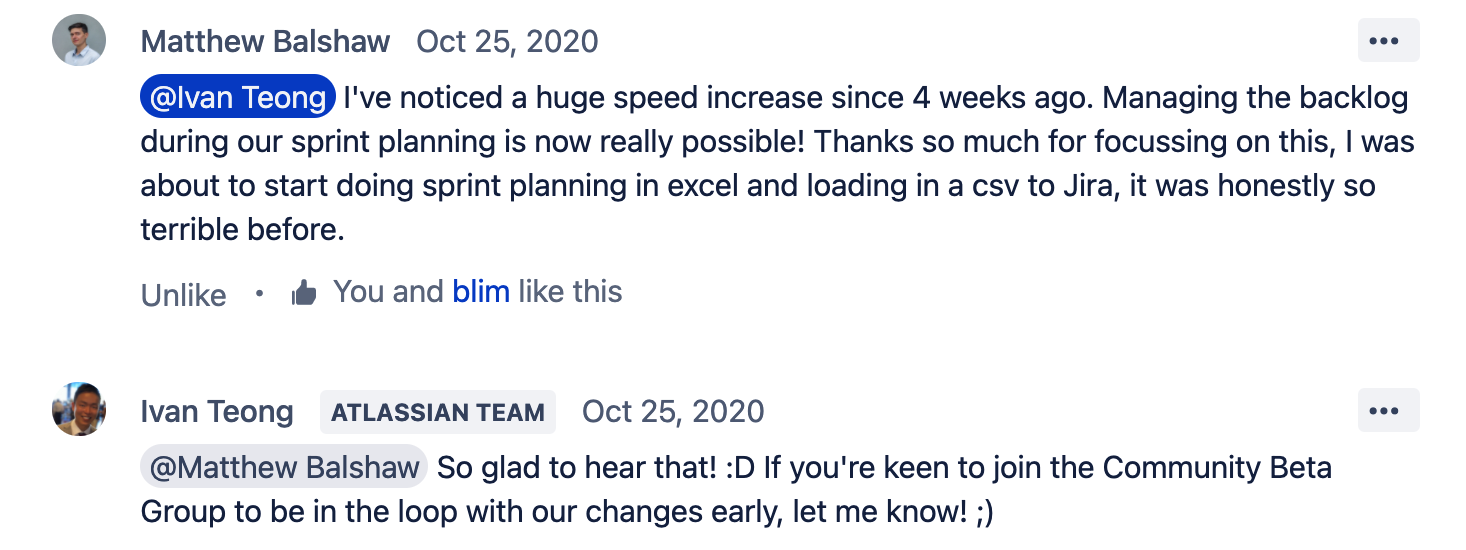
I wrote up the results for customers in a post on the Atlassian Community.
Reflection
An average describes nobody
The right metric is the one that shows you the customers you are about to lose. Since then, the first thing I ask of any headline number is who it hides.